GW Assist - ChemGraph
The goal of Groundwater Assist is simple -- let users avoid the tedious data entry of laboratory data. The process works as follows:
get the electronic data file from the lab, click one button, the data is added to your existing Excel or ChemGraph tables. If you are
using Excel, your tables are ready to print. If you are using ChemGraph, you are ready to print specialized environmental reports:
|
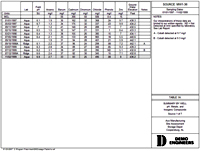
Source Summary Table
The Source Summary table shows the sampling history data for each source (ex. well, lagoon, etc.). One source is shown per page. You choose
the parameters to be shown across the top, and the sampling dates are listed down the left side. Click on the drawing to enlarge
it.
|
|
|
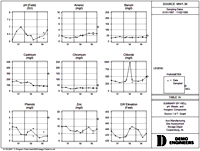
Source Summary Graph
The Source Summary graph plots the sampling history data for each source. Each parameter has its own graph with a diamond marker placed
on the right side, indicating the maximum contamination level. Viewing the graphs is a great way to scan for trends
and anomalies (notice the anomaly for chloride, for example). Click on the drawing to enlarge it.
|
|
|
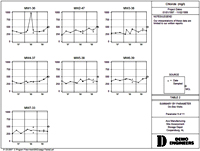
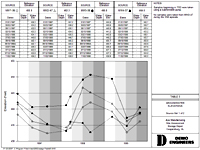
Parameter Summary Graph
The Parameter Summary graph, showing just one parameter per page, enables you to compare the values of a parameter
between a set of sources. In the example below, the first source is the background source, and the others are compared to it.
Click on the drawing to enlarge it.
|
|
|
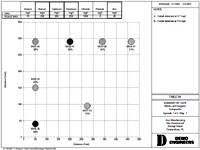
Date Summary Report
The Date Summary report shows the plume of contamination for a set of sources during one
sampling episode. The report for each episode consists of a table page and up to
10 map pages. The map page shows the sources in their physical locations on the site.
Each source area is shaded according to the level of contamination of the
parameters chosen. Click on the drawing to enlarge it.
|
|
|
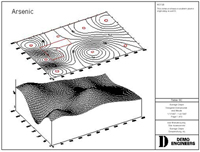
Date Contour Report
The Date Contour map links directly to Surfer to produce 2-D and 3-D contour maps. Once setup, this process
saves hours over using Surfer to manually generate maps. Click on the drawing to enlarge it.
|
|
|
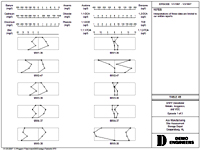
Stiff Graph Report
Like the Date Summary report, the Stiff Graph report shows the values for parameters
and sources during one sampling episode. The parameters and their scales are
shown at the top of the page. Each point on the polygons, below, is placed
according to the value for each parameter, relative to its scale, above. Thus,
the higher the value, the larger the polygon. This report gives you a way to
quickly summarize concentrations of multiple of parameters in multiple
sources. Click on the drawing to enlarge it.
|
|
|
Groundwater Elevation Graph
The GW Elevation Report shows seasonal trends in groundwater elevations. Up to four sources are plotted together, on one page.
Click on the drawing to enlarge it.
|
|